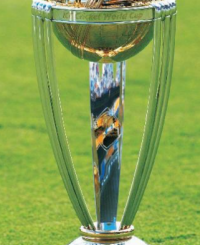
Earlier this year, the Indian cricket team won the 2011 edition of the Cricket World Cup. Although India were the favourites leading into the tournament, cricket is a sport where any of the top teams can beat any other on their day. Thanks to the existence of online cricket simulators, we can try to determine what the chances were of India winning, and how the other placings should have gone.
ODI CricSim is a flash cricket simulator that determines the results of matches by crunching over 200 variables from each player’s actual world career, including the average length of a batsman’s innings, the chance of hitting a four or a six on any given ball, the bowler’s strike rate and the bowler’s economy rate. For this experiment I used the ODI CricSim engine to run 1,000 simulated World Cups based on the quarterfinal standings of the various teams. The teams for each match were the same as the teams in the actual world, and in cases where a simulated team advanced when their actual world counterpart did not, the quarterfinal team was used for their next match.
The results were as follows:
First Quarterfinal – Pakistan vs. West Indies:
Pakistan 572
West Indies 428
Second Quarterfinal – India vs. Australia:
India 576
Australia 424
Third Quarterfinal – New Zealand vs. South Africa:
New Zealand 399
South Africa 601
Fourth Quarterfinal – Sri Lanka vs. England:
Sri Lanka 568
England 432
The results from these quarterfinal matchups suggest that New Zealand beating South Africa was the biggest upset of this stage of the tournament. South Africa was the only losing team that the simulator suggested should have won. In fact, South Africa were the team with the highest simulated chance of winning their quarterfinal, which will add more heartbreak to Proteas fans who felt that this tournament was a great chance for their team to break their Cricket World Cup duck.
First Semifinal:
There were four possible matchups for this semifinal, and the following were the predicted chances that the matchup in question would have resulted:
New Zealand vs. England (172 iterations)
New Zealand vs. Sri Lanka (same as actual world) (227 iterations)
South Africa vs. England (260 iterations)
South Africa vs. Sri Lanka (341 iterations)
The simulator results were as follows:
New Zealand vs. England: NZL 105, ENG 67.
New Zealand vs. Sri Lanka: NZL 134, SRL 93.
South Africa vs. England: SAF 181, ENG 79.
South Africa vs. Sri Lanka: SAF 180, SRL 161.
Second Semifinal:
There were four possible matchups for this semifinal, and the following were the predicted chances that the matchup in question would have resulted:
India vs. West Indies (247 iterations)
India vs. Pakistan (same as actual world) (329 iterations)
Australia vs. West Indies (181 iterations)
Australia vs. Pakistan (243 iterations)
The simulator results were as follows:
India vs. West Indies: IND 197, WIN 50.
India vs. Pakistan: IND 238, PAK 91.
Australia vs. West Indies: AUS 138, WIN 43.
Australia vs. Pakistan: AUS 186, PAK 57.
Final:
There were sixteen possible matchups for the final, and the following were the predicted chances that the matchup in question would have resulted:
India vs. South Africa (157 iterations)
India vs. Sri Lanka (same as actual world) (110 iterations)
India vs. New Zealand (104 iterations)
India vs. England (64 iterations)
Australia vs. South Africa (117 iterations)
Australia vs. Sri Lanka (82 iterations)
Australia vs. New Zealand (78 iterations)
Australia vs. England (47 iterations)
Pakistan vs. South Africa (53 iterations)
Pakistan vs. Sri Lanka (38 iterations)
Pakistan vs. New Zealand (35 iterations)
Pakistan vs. England (22 iterations)
West Indies vs. South Africa (34 iterations)
West Indies vs. Sri Lanka (24 iterations)
West Indies vs. New Zealand (22 iterations)
West Indies vs. England (13 iterations)
The simulator results were as follows:
India vs. South Africa: IND 98, SAF 59.
India vs. Sri Lanka: IND 69, SRL 41.
India vs. New Zealand: IND 63, NZL 41.
India vs. England: IND 54, ENG 10.
Australia vs. South Africa: AUS 65, SAF 52.
Australia vs. Sri Lanka: AUS 57, SRL 25.
Australia vs. New Zealand: AUS 47, NZL 31.
Australia vs. England: AUS 37, ENG 10.
Pakistan vs. South Africa: PAK 22, SAF 31.
Pakistan vs. Sri Lanka: PAK 19, SRL 19.
Pakistan vs. New Zealand: PAK 14, NZL 21.
Pakistan vs. England: PAK 12, ENG 9.
West Indies vs. South Africa: WIN 13, SAF 21.
West Indies vs. Sri Lanka: WIN, SRL 14.
West Indies vs. New Zealand: WIN 8, NZL 14.
West Indies vs. England: WIN 6, ENG 7.
These results give the following percentage chances of winning the 2011 Cricket World Cup, given the quarterfinal standings and given that the simulator is accurate:
India 28.5%
Australia 20.6%
South Africa 16.3%
New Zealand 10.7%
Sri Lanka 9.9%
Pakistan 6.7%
West Indies 3.7%
England 3.6%
It is important to note here that these rankings do not reflect the relative merits of each team, but their chances of winning the tournament given the quarterfinal standings and eventual opponents in the semifinals and final. Perhaps disappointingly for the tournament itself, the two top teams met each other in the quarterfinal stages, robbing it of what would have been a titanic final between the eventual champions and the triple defending champions.
Unless otherwise stated, PONIREVO and/or its licensors DO NOT own any intellectual property rights in the website and material on the website. Majority of the site’s content has been scraped and auto posted by a third party artificial intelligence program —– PONIREVO Creation Team.
Proudly WWW.PONIREVO.COM
by Vince McLeod


